Visible to Intel only — GUID: lwt1512070203166
Ixiasoft
5.3.8. Power Monitor
The Power Monitor measures and reports current power information and communicates with the Intel® MAX® 10 device on the board through the JTAG bus. A power monitor circuit attached to the Intel® MAX® 10 device allows you to measure the power that the FPGA is consuming.
To start the application, click the Power Monitor icon in the BTS. You can also run the Power Monitor as a stand-alone application. The PowerMonitor.exe resides in the <package dir>\examples\board_test_system directory.
Note: You cannot run the stand-alone power application and the BTS simultaneously. Also, you cannot run power and clock interface at the same time.
Figure 19. Power Monitor Interface
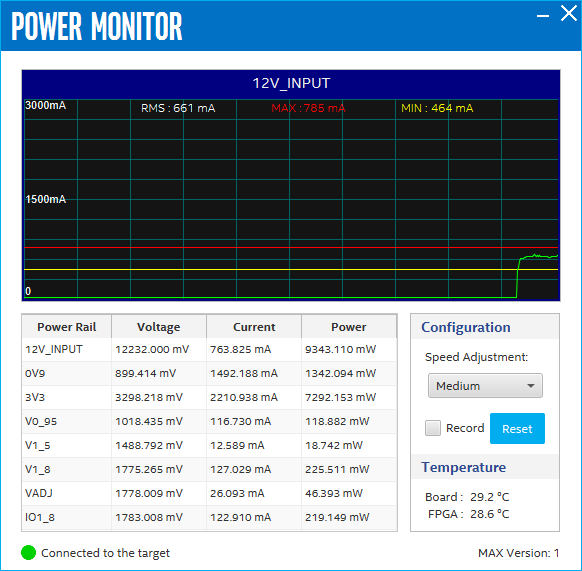
The controls on the Power Monitor are described below.
| Options | Description |
|---|---|
| Graph | Displays the mA power consumption of your board over time. The green line indicates the current value. The red line indicates the maximum value read since the last reset. The yellow line indicates the minimum value read since the last reset. It also displays root mean square (RMS) current, maximum and minimum numerical power readings in mA. |
| Table | Displays real time values of power rails. It refreshes about every 10 seconds. When you click some rail, the power rail will show on the Graph Chart. |
| Configuration | Speed Adjustment: Specifies how often to refresh the graph. Date Record: Record real time voltage, current and power values, and save to a log file. |
| Reset | Clears the graph, resets the minimum and maximum values and restarts the Power Monitor. |
| Temperature | Displays the temperature of the FPGA and the development kit. |