Visible to Intel only — GUID: cdm1656550926373
Ixiasoft
1.1. Compilation Overview
1.2. Using the Compilation Dashboard
1.3. Design Netlist Infrastructure
1.4. Using the Node Finder
1.5. Precompiled Component (PCC) Generation Flow
1.6. Analysis & Elaboration Flow
1.7. Design Synthesis
1.8. Design Place and Route
1.9. Incremental Optimization Flow
1.10. Fast Forward Compilation Flow
1.11. Full Compilation Flow
1.12. Compilation Monitoring Mode
1.13. Exporting Compilation Results
1.14. Integrating Other EDA Tools
1.15. Compiler Optimization Techniques
1.16. Synthesis Language Support
1.17. Synthesis Settings Reference
1.18. Fitter Settings Reference
1.19. Design Compilation Revision History
1.7.3.1. Registering the SDC-on-RTL SDC File
1.7.3.2. Applying the SDC-on-RTL Constraints
1.7.3.3. Inspecting SDC-on-RTL Constraints
Tcl Console
RTL Analyzer
Quartus® Prime Timing Analyzer
1.7.3.4. Creating Constraints in SDC-on-RTL SDC Files
1.7.3.5. Using Entity-Based SDC-on-RTL Constraints
1.7.3.6. Types of SDC Files Used in the Quartus® Prime Software
1.7.3.7. Example: Using SDC-on-RTL Features
1.13.1. Exporting a Version-Compatible Compilation Database
1.13.2. Importing a Version-Compatible Compilation Database
1.13.3. Creating a Design Partition
1.13.4. Exporting a Design Partition
1.13.5. Reusing a Design Partition
1.13.6. Viewing Quartus Database File Information
1.13.7. Clearing Compilation Results
2.1. Factors Affecting Compilation Results
2.2. Strategies to Reduce the Overall Compilation Time
2.3. Reducing Synthesis Time and Synthesis Netlist Optimization Time
2.4. Reducing Placement Time
2.5. Reducing Routing Time
2.6. Reducing Static Timing Analysis Time
2.7. Setting Process Priority
2.8. Reducing Compilation Time Revision History
Visible to Intel only — GUID: cdm1656550926373
Ixiasoft
1.7.3.3. Inspecting SDC-on-RTL Constraints
You can access SDC-on-RTL constraints in multiple ways in the order of the earliest opportunity in the flow, as described in the following sections:
Note: In all of the methods discussed in this section, the SDC-on-RTL constraints are read-only. You cannot modify the constraints in the compilation flow. You can only change the constraints by changing the source RTL SDC file and reloading it during Analysis and Elaboration.
Tcl Console
The Tcl console allows you to experiment conveniently with targeting constraints and the related syntax. The netlist is read-only when accessed from the Tcl console, and constraint commands are not saved into the design database.
Access the Tcl Console through the command-line interface using the following command:
quartus_syn -s
Once the Analysis & Elaboration compilation stage completes, you can load the project in the console (project_open <project_name>) and load the appropriate checkpoint using the dni::load_design -checkpoint "constrained" command. You can now perform tasks such as:
- Read a specific SDC file using the dni::read_sdc<file_name> command.
- Dump constraints using the dni::write_sdc command.
- Run constraint commands that are limited to the local session. For more information, refer to Creating Constraints in SDC-on-RTL SDC Files.
RTL Analyzer
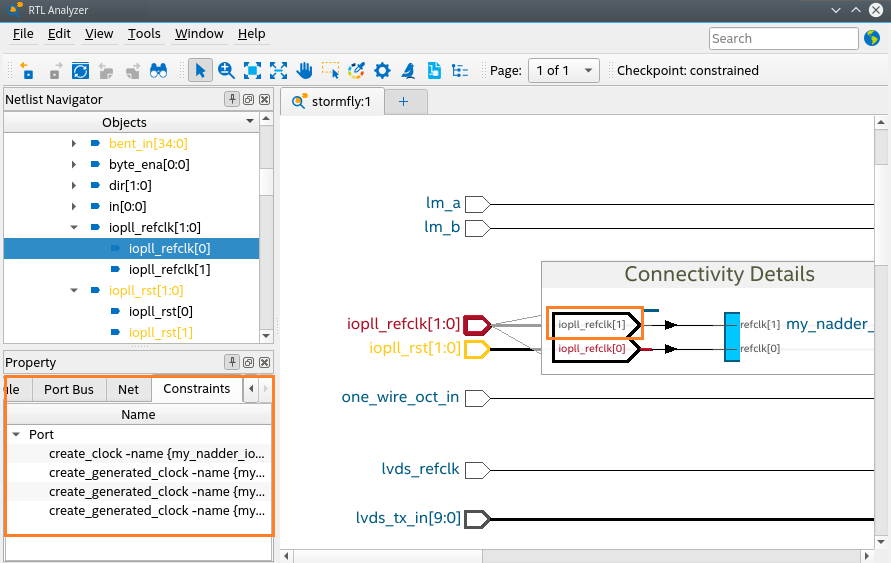
To invoke the RTL Analyzer (Constrained mode) from the compilation dashboard, enable the RTL Analysis Debug Mode option under Project > Settings as described in Analysis & Elaboration. The RTL Analyzer GUI allows you to view the constraints on the design netlist. When you select a netlist object in the schematic viewer or Netlist Navigator, you can view constraints targeting that object in the Property viewer. This helps ensure the constraints target the intended nodes in your RTL.
In the following example, when you select iopll_refclk[1:0] and right-click and select Display Individual Bits from its context-sensitive menu, the Connectivity Details pop-up window displays its ports. When you select one of the ports, constraints applied to the port are displayed in a separate Constraints tab, as shown in the following image:
Figure 43. Viewing Constraints in the RTL Analyzer
Besides the constraints of the selected object, the Constraints tab also includes constraints of the associated object. For example, a net bus’ constraints are included along with the net's constraints, an instance bus’ constraints with the instance’s constraint, and so on.
Figure 44. Viewing Constraints of Associated Objects

Note: You can cross-probe the SDC file by right-clicking on a constraint in the Property viewer and selecting the View in Source option.
You can also launch the Constraints dialog box (Tools > Object Constraints) from the RTL Analyzer menu to view a list of all constraints (assignments and timing-related SDC). It allows you to select an assignment or a constraint and cross-probe to its source file by right-clicking and selecting View in Source. The source file that contains the assignment or constraint launches in the Quartus® Prime GUI with the assignment line highlighted.
Figure 45. Object Constraints
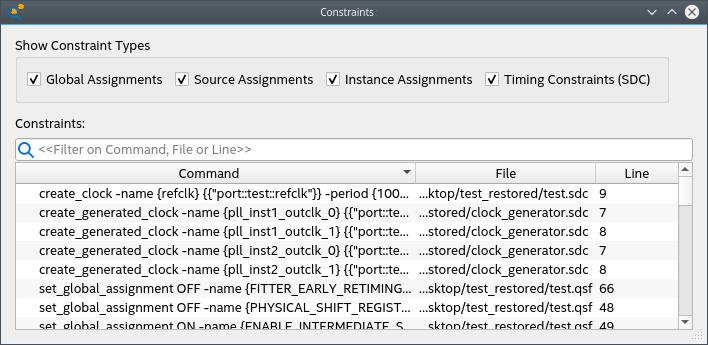
The Constraints GUI allows you to filter four types of constraints:
- Global Assignments: Assignments that are created with the set_global_assignment command.
- Source Assignments: Assignments embedded in source RTLs.
- Instance Assignments: Assignments created with the set_instance_assignment command.
- Timing Constraints (SDC): Constraints created through SDC-on-RTL. They usually appear in the Constrained view of the Analysis & Synthesis stage. If no SDC is read in, the Timing Constraints (SDC) option is disabled. This can happen in views before SDC are read in, for example, in "Elaborated" and "Instrumented" views of the Analysis & Synthesis stage or when no SDC-on-RTL file is read in.
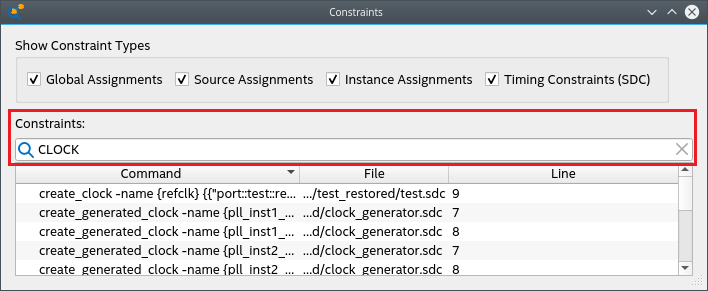
You can filter the constraints further using the filtering field to view constraints matching the string. It supports filtering through command name, file name, and line number. You can also sort the constraints using the Command, File, and Line column header.
Figure 46. Filtering Constraints
Through the context-sensitive menu of the Constraints GUI, you can view the selected constraints in its source file or the objects that it applies to.
Figure 47. Context-Sensitive Menu of the Constraints GUI
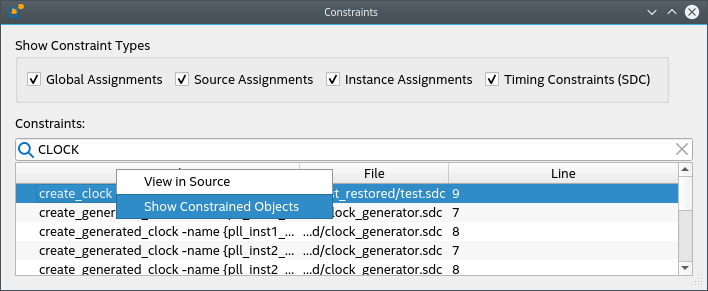
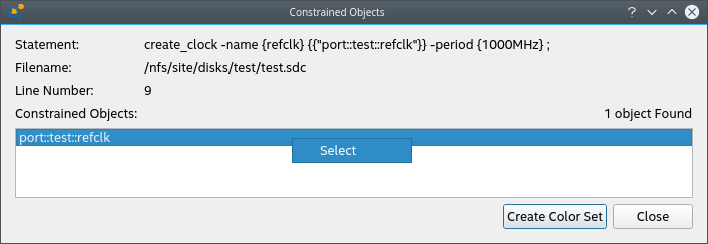
You can view objects that a constraint apply to through the Show Constrained Objects option, which displays the Constrained Objects dialog. In the Constrained Objects, you can select the constrained object through its context-sensitive menu. This allows you to view the object's property in the Property Viewer. You can also apply a color to each constrained object by clicking Create Color Set.
Figure 48. Constrained Objects
Quartus® Prime Timing Analyzer
The Quartus® Prime Timing Analyzer uses industry-standard constraint and analysis methodology to report on all data required times, data arrival times, and clock arrival times for all register-to-register, I/O, and asynchronous reset paths in your design. The Timing Analyzer verifies that the required timing relationships are met for your design to function correctly and confirms actual signal arrival times against the constraints you specify. For more information about the Timing Analyzer, refer to the Quartus® Prime Pro Edition User Guide: Timing Analyzer .
Using the Timing Analyzer GUI or Tcl command console, you can load SDC-on-RTL constraints into the timing analysis session by running the read_sdc command. By default, the read_sdc command always loads SDC-on-RTL constraints, which happens before loading other conventional Quartus® Prime software SDC files (SDC_FILE ).
During static timing analysis, you can load only the SDC-on-RTL SDC constraints using the import_sdc command. This is helpful when debugging issues you suspect are caused by SDC-on-RTL constraints.
To disable the loading of SDC-on-RTL constraints during the calls to read_sdc, use the read_sdc -no_import option or set the QSF variable ENABLE_IMPORT_SDC_DURING_READ_SDC to OFF.
Note: If you change the actual SDC-on-RTL files and import them using read_sdc or import_sdc command without rerunning Analysis & Elaboration, the Timing Analyzer issues a warning message informing you that changes to the SDC-on-RTL files will not be observed until Analysis & Elaboration is rerun.
Once you import the constraints using the read_sdc or import_sdc command, they become standard constraints in the Timing Analyzer. Standard constraint diagnostic reports (report_exceptions, report_sdc, and so on) operate on these constraints, and you can update the constraints for the current Timing Analyzer session using the existing Quartus® Prime timing analysis API commands.
Note: You can cross-probe the constraints in the report_sdc by right-clicking on the Location column of a constraint and selecting Locate in Constraint File.
Figure 49. SDC Report in the Timing Analyzer
