Story at a Glance
- The 2023.1 release of Intel® oneAPI tools included enhancements to Intel® VTune™ Profiler that help developers take full advantage of multiarchitecture performance on the Intel® Max Series product family of CPUs and GPUs.
- Intel Max Series processors deliver breakthrough performance and unblock bottlenecks for memory-bound workloads that can be challenging for many AI and HPC applications. The CPU is the first and only x86-based processor with high-bandwidth memory (HBM). The GPU packs over 100 billion transistors into a package and contains up to 128 Xe Cores.
- Intel VTune Profiler is optimized to help developers identify issues in code running on CPUs, GPUs, and FPGAs. For Max Series CPUs, it includes HBM-specific performance metrics that identify the usage of HBM memory by workload. On Max Series GPUs, VTune Profiler can be used for visibility into Xe Link cross-card traffic; uncover issues such as stack-to-stack traffic, throughput, and bandwidth bottlenecks; and identify imbalances of traffic between CPU and GPU.
Intel® Max Series Processors: Maximizing Memory and Compute for HPC & AI Workloads
There is a large diversity in HPC codes, with some applications such as life sciences and manufacturing being compute-bound and others such as earth systems, oil and gas, and AI being memory-bound. On the CPU front, growth in memory bandwidth has lagged behind HPC and AI compute performance. Furthermore, workload performance hasn’t kept up with compute—while core count and core enhancements have increased, data hasn’t been efficiently fed to those cores. On the GPU front, there has been too little memory capacity. At the same time, data movement overhead between CPUs and GPUs has resulted in lost performance and wasted energy.
Intel Max Series processors were created to address these issues.
Starting with CPUs, the Intel® Xeon® processor Max Series is the first and only x86-based processor with high-bandwidth memory (HBM), delivering up to 4.8X better performance compared to competition on real-world HPC and AI workloads1. They feature:
- Up to 56 performance cores constructed of four tiles and connected using Intel’s embedded multi-die interconnect bridge (EMIB) technology.
- 64GB of ultra-high-bandwidth in-package memory plus support for PCI Express 5.0 and CXL1.1 I/O.
- Up to 1.14GB of HBM capacity per core.
This provides GPU-level memory bandwidth at scale for the majority of HPC codes that run on a CPU. Additionally, these CPUs help you maximize bandwidth to feed data more efficiently to processor cores across three memory modes:
- HBM Only – for workload capacity of 64GB or less
- HBM Flat Mode – flat memory regions with HBM and DRAM for workload capacity of 64GB or more
- HBM Caching Mode – with DRAM-backed cache for improved performance for workload capacity greater than 64GB
Moving to GPUs, the Intel® Data Center GPU Max Series is Intel’s highest performing, highest density, general-purpose discrete GPU, which packs over 100 billion transistors into a package and contains up to 128 Xe Cores—Intel’s foundational GPU-compute building block. They feature:
- 408 MB of L2 cache based on discrete SRAM technology and 64 MB of L1 cache.
- Up to 128 ray-tracing units for accelerating scientific visualization and animation.
- AI-boosting Intel® Xe Matrix Extensions (Intel® XMX) with deep systolic arrays enabling vector and matrix capabilities in a single device.
Together, Intel Max Series CPUs and GPUs also make it easier to share code investment between CPU and GPU.
So, how can you tell if your workload will benefit from HBM and which mode you should use? How do you optimize data traffic between CPU and GPU? That’s where Intel® VTune™ Profiler comes in.
Intel® VTune™ Profiler: One Tool to Optimize Multiple CPU-GPU Workloads
Intel VTune Profiler is a powerful performance analysis tool to identify issues that slow down the code running on CPU, GPU, or FPGA, enabling developers to focus their tuning effort and get the best performance gain in the least amount of time.
Will Your Workload Benefit from HBM?
You can use VTune Profiler to identify which memory mode offers the best performance utilizing HBM on the Intel Xeon processor Max Series. Profile your workload for each mode: HBM, flat, or cache.
To evaluate the benefits of HBM, the following analysis types can be used:
- Memory Access analysis
- Microarchitecture Exploration analysis with the Analyze memory bandwidth option enabled
- HPC Performance Characterization analysis with the Analyze memory bandwidth option enabled
VTune Profiler includes HBM-specific performance metrics that can help understand the usage of HBM memory by the workload. The workload performance can be analyzed in the context of HBM memory by reviewing the following viewpoints:
Bandwidth Utilization Histogram
The bandwidth utilization section of the Summary window is updated to include two HBM-specific metrics: “HBM, GB/sec” and “HBM Single-Package, GB/sec” (Figure 1). These domains show data like the DRAM bandwidth domain but in the context of HBM.
The bandwidth utilization histogram helps to understand the HBM memory utilization in the Low, Medium, and High utilization categories.
Single-Package domains are displayed for the systems with more than two CPU packages and the histogram for them shows the distribution of the elapsed time per maximum bandwidth utilization among all packages. Use this data to identify situations where your application utilizes bandwidth only on a subset of CPU packages. In this case, the whole system bandwidth utilization represented by domains like DRAM may be low, whereas the performance is in fact limited by bandwidth utilization. You can switch to Bottom-up window and group the grid data by ../Bandwidth Utilization Type/.. and identify functions or memory objects with high bandwidth utilization in the specific bandwidth domain.
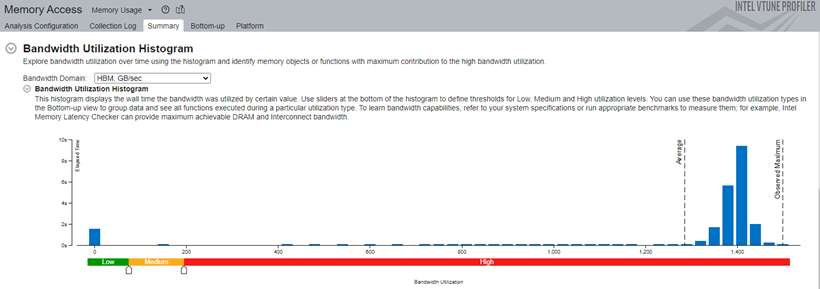
Figure 1. How is bandwidth distributed
Timeline Pane
To identify bandwidth issues in your workload over time, focus on the Timeline pane provided at the top of the Bottom-up window (Figure 2). The timeline pane includes the overtime view of the HBM bandwidth split by CPU packages. The view includes HBM Read/Write Bandwidth and HBM Bandwidth (total) graphs. You may focus on analyzing specific parts of the bandwidth graph by selecting the region or filter the graphs using the HBM Bandwidth checkboxes on the right side.
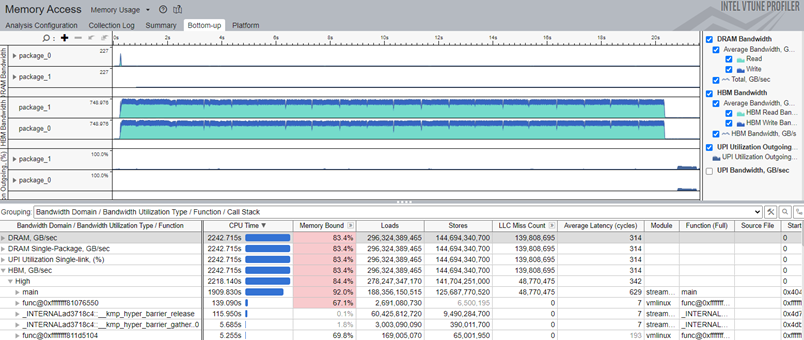
Figure 2. The workload performance in various HBM modes can be evaluated by running the collection in each mode and analyzing the bandwidth as described above.
How Do We Ensure Optimal Data Traffic between CPU and GPU?
You can also use Intel VTune Profiler for visibility into Xe Link cross-card traffic on the Intel Data Center GPU Max Series for issues such as stack-to-stack traffic, throughput, and bandwidth bottlenecks. It helps identify imbalances of traffic between CPU and GPU through a GPU topology diagram.
To evaluate the benefits of Xe Link cross-card interconnect, the following analysis types can be used:
- GPU Offload with the Analyze Xe Link usage option enabled.
- GPU Compute/Media Hotspots with the Analyze Xe Link usage option enabled.
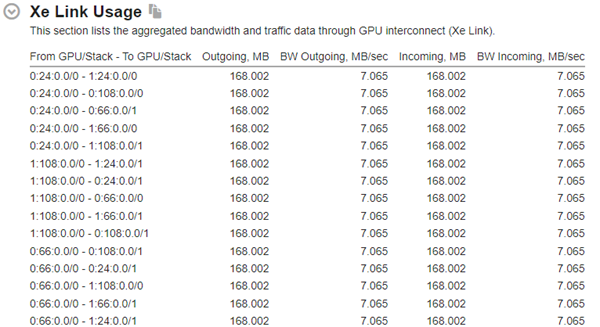
Intel VTune Profiler includes Xe Link traffic and bandwidth observability that can help understand cross-card memory transfers and Xe Link utilization by the workload. Grid with overall card-to-card traffic and bandwidth by Xe Link can be found on Summary view of result.
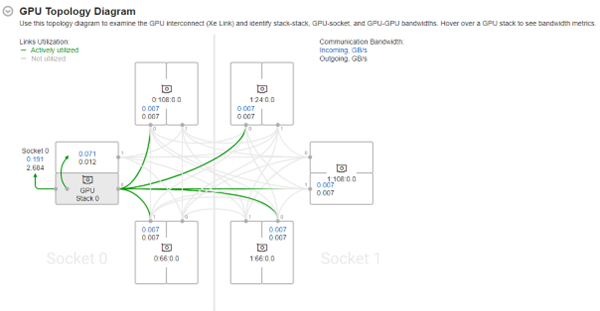
Also, cross-card, stack-to-stack and card-to-socket bandwidth are presented on GPU Topology Diagram on Summary. It can help to understand GPU topology of the system and estimate communication bandwidth of exact link, stack, or card by selection of part with hovering.
For deeper analysis of cross-card memory transfers users can use timeline on platform panel. With bandwidth over time can see usage of Xe Link by different phases of workload, reaching maximums and correlate it with code execution.

To get started, download Intel VTune Profiler and get the code samples.