Introduction
If you are a developer seeking to optimize your games or interactive 3D rendering applications for Intel Processor Graphics and Dedicated Graphics with Xe-LP architecture, then you have come to the right place. The list of Xe-LP based platforms includes:
- 11th Gen Intel® Core™ processor family (Codename Tiger Lake, Rocket Lake)
- 12th Gen Intel® Core™ processor family (Codename Alder Lake)
- 13th Gen Intel® Core™ processor family (Codename Raptor Lake)
- Intel® Iris® Xe Dedicated Graphics family (Codename DG1)
In this document, you will find optimization methods for the Xe-LP GPU architecture, best practices to most effectively harness the architecture’s capabilities and peak performance, and guidance for using the latest graphics application programming interfaces (APIs).
It’s recommended that you bring a knowledge of the graphics API pipelines for Microsoft DirectX 12*, Vulkan*, and/or Metal* 2. Xe-LP GPUs supports the DirectX* 11 and OpenGL* graphics APIs, but the performance benefits with DirectX 12, Vulkan and Metal 2 are greater, and some new graphics architecture features are only available in these APIs.
Intel® Xe-LP Architecture Highlights
Xe-LP delivers new features such as coarse pixel shading, tile-based rendering, and display controller elements. In addition, Xe-LP offers the following improvements over previous generations:
- Compute capabilities that deliver up to 2.2 Teraflop performance
- Up to 96 execution units (EUs)
- Improved compression
- Significantly lower shared local memory (SLM) latency
- 1.25x increase in L3 cache size over Gen11
- Increased memory bandwidth by 2x
- Improved multi-sample anti-aliasing (MSAA) performance
- Added support for new 10-bit float formats (R10B10G10_FLOAT_A2_UNORM)
For a more in-depth overview of the Gen11 architecture and new features, access the guide here: Intel® Processor Graphics Gen11 Architecture.
Variable Rate Shading
Variable rate shading means the shading rate can be varied independently from the render target resolution and rasterization rate. This allows you to reduce the number of pixel shader invocations for content that has slow varying shading parameters, or for pixels that may be blurred later in the rendering pipeline. In short, you can direct shader operations to the pixels that matter the most. This provides a better visual solution than rendering at a lower resolution and then upscaling, as you preserve the depth and stencil at full pixel rate. Xe-LP hardware supports DirectX 12 variable rate shading (VRS) Tier 1. For more information on enabling VRS Tier 1 in your application, refer to the Get Started with Variable Rate Shading on Intel® Processor Graphics white paper.
High Dynamic Range Displays
Xe-LP architecture features additional support and improvements for high dynamic range (HDR) images and displays. It’s integrated with FP16 for faster rendering speeds of deep color bit depths (10, 12, and 16 bits per channel), and has Dolby Vision* capable input.
Xe-LP is fully compatible with the VESA DisplayHDR* and Ultra High Definition (UHD) Premium* display certifications, and already supports Dolby Vision* ahead of future consumer monitor releases.
For additional information on HDR, see:
Enabling HDR with Microsoft DirectX 11 and DirectX 12
High Dynamic Range and Wide Color Gamut
Adaptive Sync—Variable Refresh Rate
If application and platform conditions are met, the Xe-LP driver, by default, enables Adaptive Sync. VESA-certified Adaptive Sync ensures a fast refresh rate for your display, reduces tearing and stuttering, and can lower overall system power consumption. Basic requirements for Adaptive Sync are:
- Full-screen rendering by the game or 3D application
- Simple application swap chain modification to ensure asynchronous buffer flips
- A Gen11 or later graphics device with DisplayPort 1.4 (or later) VESA Adaptive Sync support
- A DisplayPort 1.4 (or later) VESA Adaptive Sync capable display panel
- Windows* 10 RS5 and beyond
The game, or 3D application, must ensure that its rendering swap-chain implements asynchronous buffer flips. On displays with Adaptive Sync, this results in smooth interactive rendering, with the display refresh dynamically synchronized with the asynchronous swap chain flips. Adaptive Sync can be disabled if you choose to, via the Intel graphics control panel. For more information, access this guide: Enabling Intel® Adaptive Sync.
Dual Queue Support
With Xe-LP, independent scheduling queues allow the simultaneous residency and execution of up to two contexts from the same parent application. Dual residency of 3D work and compute work then has minimal impact on performance.
DirectX 12 View Instancing and Vulkan* Multiview
This feature targets redundant geometry processing, such as when there is a shared use of the geometry between different views based on the position of the camera—each side of a cube map, for example, cascades of shadow maps, and/or stereo view.
- Usually, draw calls will be sent from the CPU to the GPU multiple times. This can become a bottleneck for scenes with a lot of objects or draw calls. Xe-LP enables replicating geometry for multiple views in a single pass. By converting multiple passes, or instances where the geometry is processed the same way to a single pass, Xe-LP avoids redundant CPU and GPU work.
- Xe-LP supports Tier 2 level of view instancing on D3D12, and works in conjunction with VRS for further performance gains.
DirectX12 Sampler Feedback
Sampler Feedback is a hardware-accelerated feature that was introduced in DirectX 12.2 and is supported by Xe-LP. Conceptually, it is the reverse of texture sampling: the shader Sample() intrinsic reads a number of texels from a texture and returns an average value. The new WriteSamplerFeedback() shader intrinsic writes to a binary resource, "marking" the texels that would have been read. This enables two important usages:
- Sampler Feedback Streaming: when objects are drawn, we can simultaneously collect data about what texture data was required to draw the scene. By dynamically streaming only the visible portions of resources just-in-time, we can draw a scene that accesses more textures than could simultaneously fit in physical graphics memory, if they all had to be entirely physically resident. Sampler Feedback includes a "min mip map" feature to facilitate this usage: a single-layer texture where each texel represents a region of the streaming texture. Each texel is an integer (byte) representing the minimum mip that was sampled in that region. If the sampler feedback region size is set to match the tile-size of a reserved resource, the result is a map that informs what tiles to stream. Min-mip-maps are very small—for example, for a 16kx16k BC7 reserved resource, the corresponding sampler feedback min-mip-map, with region size 256x256, is only 64x64 bytes or 4KB in size, and represents a 350MB texture.
- Texture Space Rendering: Texture-Space Rendering was pioneered by Intel in a Siggraph 2014 research paper [Clarberg et al. 2014]. At that time, we observed that the cost of pixel shading is tightly coupled to both the geometric complexity and the screen resolution which has only increased over time as workloads enable richer visual environment using tessellation, complex lighting calculations using pixel shading and higher resolution displays. Instead of shading directly through traditional pixel shaders, the application uses Sampler Feedback to mark a mask which corresponds to the texels it requires. This mask can then be referenced in a subsequent compute shader pass, and the required texels can be shaded at a resolution and frequency determined by the developer in texture space as opposed to a fixed screen space resolution and frame frequency. Once shading to texels is completed, in a separate lighter-weight pass, pixels in screen-space are mapped into texture space, and the corresponding texels are sampled and filtered using standard texture lookup operations. This feature allows pixel shading to be largely independent of the geometric complexity or screen resolution and adds new texture LOD methods to control level of shading detail. These abilities are introduced to temporally decouple the shading pipeline from the traditional sample, pixel or coarse shading rates. AMFS can provide sizable gains over traditional pixel shader approaches as shader complexity, geometry or MSAA samples increases.
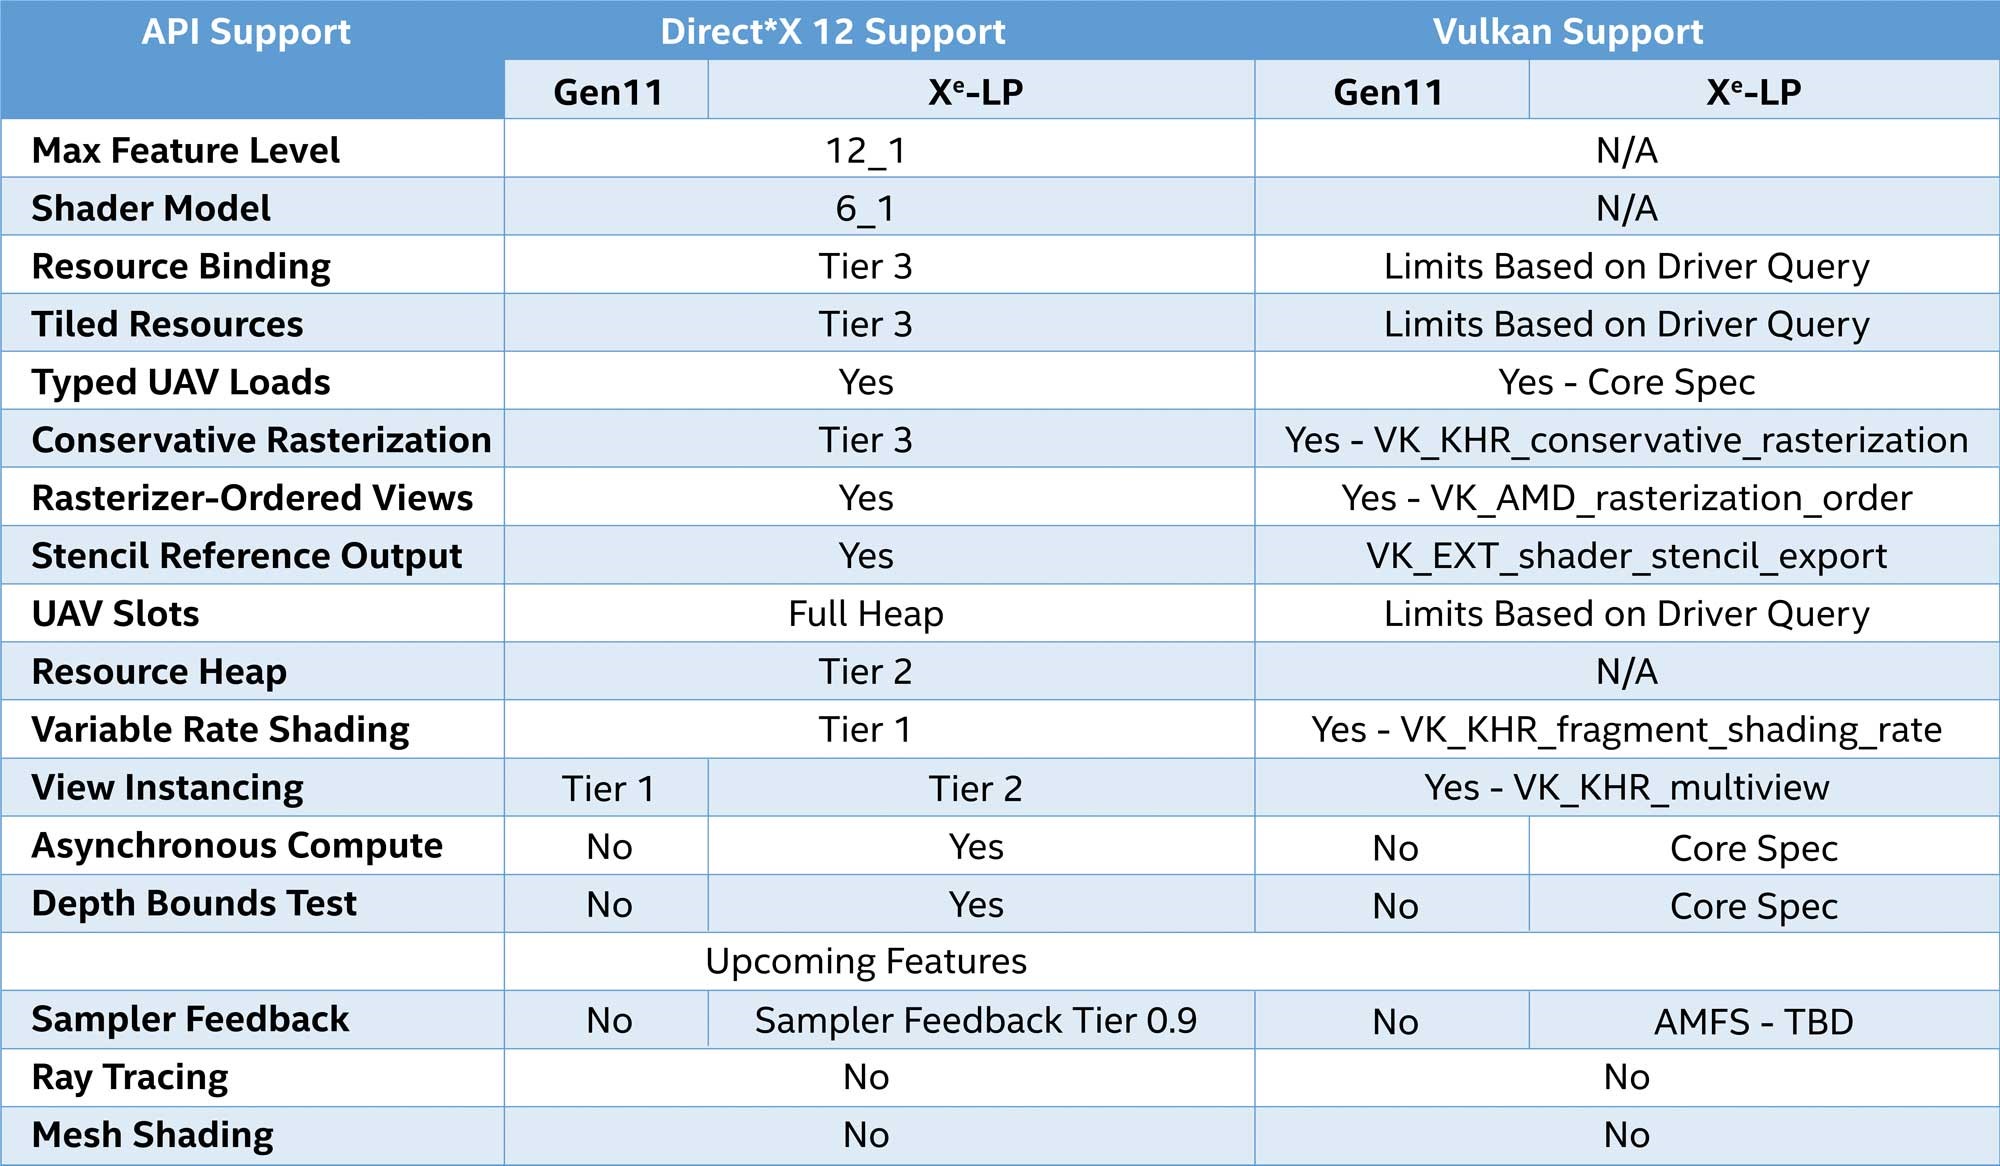
Other API Feature Support
The table below illustrates which features that are part of the D3D12 map to ICL and Xe-LP products, as well as correspond to Vulkan.
Tools for Performance Analysis
When optimizing, you want to measure the benefit. Intel provides two major tools to help improve application performance on both CPUs and GPUs. Intel® Graphics Performance Analyzers (Intel® GPA) and Intel® VTune™ Profiler are both free to download.
Intel® Graphics Performance Analyzers
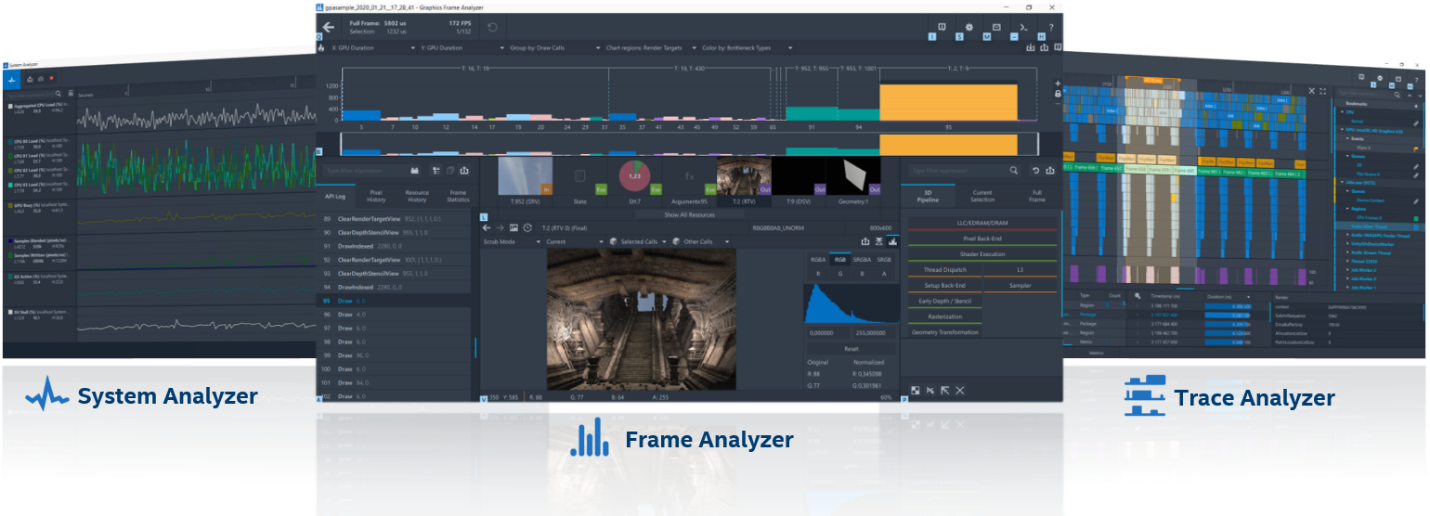
Intel GPA is a suite of powerful, agile tools that enable you to use the full performance potential of your gaming platform, including, though not limited to, Intel® Core™ processors and Intel GPA. Intel® GPA Intel GPA tools visualize performance data from your application, enabling you to understand from system-level to individual frame performance issues.
Graphics Frame Analyzer
Graphics Frame Analyzer is a powerful, intuitive, single frame and multi frame (DirectX 11, DirectX 12, and Vulkan*) analysis and optimization tool. It provides deep frame performance analysis down to the draw call level, including shaders, render states, pixel history, and textures. You can conduct what-if experiments to see how changes iteratively impact performance and visuals without having to recompile your source code.
With Graphics Frame Analyzer you can:
- Graph draw calls to identify most expensive calls manually.
- Use the powerful Hotspot Analysis mode to automatically identify the most problematic calls and their bottlenecks.
- Analyze execution of shaders in Shader Profiler.
- View the history of any given pixel.
- Apply various experiments to quickly assess the potential impact in performance and visual quality of an optimization.
- Study the geometry, wireframe, and overdraw view of any frame.
- Automate and streamline multiple aspects of your profiling workflow using the Python* plug-in interface.
Graphics Trace Analyzer
Graphics Trace Analyzer is a time-based trace capture tool which gives deeper insight into the execution flow of an application and the system. This can help you ensure that your software takes full advantage of the processing power available from today’s Intel® platforms.
With Graphics Trace Analyzer, you can:
- Correlate system and per-application data on one timeline from various data sources (ETW, ITT, graphics API, sampled metrics, etc.)
- Identify CPU and GPU bound applications by exploring CPU threads and GPU hardware and per-context driver queues.
System Analyzer
System Analyzer is a real-time tool that displays CPU, graphics API, and GPU performance metrics. System Analyzer can help you quickly identify key performance opportunities and whether your workload is CPU or GPU bottlenecked—allowing you to focus optimization efforts on elements that have the most performance impact on your application.
With System Analyzer you can:
- Display real-time system and per-process metrics.
- Metrics available include data from the CPU, GPU, graphics driver, graphic APIs, and FPS.
- Perform various what-if experiments using override modes to quickly isolate many common performance bottlenecks.
Intel® GPA Framework
Intel® GPA Framework is a cross-platform, cross-API suite of tools and interfaces, which allows users to capture, playback and analyze graphics applications.
In a nutshell, an Intel® GPA Framework user can do a real time analysis of a running application using custom layers, capture a multi frame stream of a running application starting either from application startup or an arbitrary point of time, playback the stream to recreate the application graphics execution or create a script that can play back a stream up to a given frame, get a list of API calls, get metrics, and produce a performance regression report.
Intel® GPA Cookbook
To help debug performance issues, the GPA cookbook provides performance analysis scenarios to help solve performance issues in your application across different parts of the hardware, from shader execution to sampler operations. It also provides descriptions of the metrics found in GPA Frame Analyzer. To use this guide, see The Intel Graphics Performance Analyzers Cookbook.
Intel® VTune™ Profiler
Intel® VTune™ Profiler can assist not only with finding CPU or GPU bottlenecks, it can also help to optimize work being done by the CPU when tuning for performance. For tuning performance on DirectX applications, Intel® VTune™ Profiler can detect slow frames and detect DirectX events. Intel® VTune™ Profiler also supports customization of tracing events through its Frame and Event APIs. For more information on how to set up and use Intel® VTune™ Profiler, see the extensive documentation on Intel® VTune™ Profiler in the Intel® VTune™ Profiler User Guide.
While the scope of this guide is only limited to performance optimizations on Xe-LP, this guide provides an overview of key features that are helpful for developers when tuning performance on workloads that are more graphical in nature, such as gaming applications.
Automatic DirectX* Frame Detection for Windows*
Intel® VTune™ Profiler can detect slow frames and detect DirectX events. Using this, you can identify slow frames and filter the events in that frame.
Frame and Event API
Using the Frame and Event API in Intel® VTune™ Profiler allows for the customization of tracing events that can be profiled by Intel® VTune™ Profiler. The Frame API allows for this to be done on a per frame basis. For instance, in a game application, it is best to surround the game loop with begin and end events to profile per frame. More information and examples on the Intel® VTune™ Profiler Frame API can be found in the Frame API documentation.
The Event API allows for custom demarcation of events in your software for profiling. For instance, to help optimize tasks in a game, you could use the Event API to track individual tasks needed to compute a frame in a gaming application. More information and usage on the Intel® VTune™ Profiler Event API can be found in the Event API documentation.
Performance Recommendations for Intel® Xe-LP Graphics Processors
DirectX 12, Metal, and Vulkan give developers more control over lower-level choices that were once handled in driver implementations. Although each API is different, there are general recommendations for application developers that are API-independent.
Configuring Graphics Pipeline State
When configuring pipeline states, consider the following:
- When creating Pipeline State Objects (PSOs), make sure to take advantage of all the available CPU threads on the system. In previous APIs, the driver would create these threads for you, but now you must create the threads yourself.
- Compile similar PSOs on the same thread to improve deduplication done by the driver and runtime.
- Define optimized shaders for PSOs instead of using combinations of generic shaders mixed with specialized shaders.
- Avoid defining depth plus stencil format if stencil will not be used. Use depth-only formats, such as D32.
- The driver will attempt to reuse shader compilations from PSOs it has already created. However, certain differences between PSOs could lead to the same shader code being recompiled again. Factors and changes that could cause a given stage to be recompiled include but are not limited to:
- Vertex Shader
- pRootSignature
- InputLayout
- ViewInstancingDesc
- Using SV_ViewID in a subsequent stage
- The input signature for the subsequent stage
- Hull Shader
- pRootSignature
- Using SV_ViewID in a subsequent stage
- The input signature for the DS
- Domain Shader
- pRootSignature
- ViewInstancingDesc
- Using SV_ViewID in a subsequent stage
- The input signature for the subsequent stage
- Geometry Shader
- pRootSignature
- ViewInstancingDesc
- Using SV_ViewID in a subsequent stage
- The input signature for the PS
- Pixel Shader
- pRootSignature
- BlendState
- RasterizerState.ForcedSampleCount
- RasterizerState.ConservativeRasterization
- DepthStencilState.StencilEnable
- NumRenderTargets
- SampleDesc.Count
- Vertex Shader
Resource Binding
Modern Graphics APIs give you more control over resource binding, such as with DirectX Root Signatures and Vulkan* Pipeline Layout. Using these requires particular attention to maximize performance. When designing an application strategy for resource binding, employ the following guidance:
- Minimize the number of root signature slots or descriptor sets to only what will be used by a shader.
- Try to find a balance between root signature or descriptor set reuse across shaders.
- For multiple constant buffers that do not change between draws, consider packing all constant buffer views into one descriptor table.
- For multiple Unordered Access Views (UAVs) and Shader Resource Views (SRVs) that do not span a consecutive range of registers and do not change between draws, it is best to pack them into a descriptor table.
- Minimize descriptor heap changes. Changing descriptor heaps severely stalls the graphics pipeline. Ideally, all resources will have views appropriated out of one descriptor heap.
- Avoid generic root signature definitions where unnecessary descriptors are defined and not leveraged. Instead, optimize root signature definitions to the minimal set of descriptor tables needed.
- Vulkan: When creating a Descriptor Set, using the BindAfterFlag bit beware that Xe-LP only supports 1M Descriptors. Only Create needed descriptors (when porting from DX12, remember that D3D12_DESCRIPTOR_HEAP_TYPE_CBV_SRV_UAV maps to 7 Vulkan types [ VK_DESCRIPTOR_TYPE_SAMPLED_IMAGE, *_STORAGE_IMAGE,* _UNIFORM_TEXEL_BUFFER,*_STORAGE_TEXEL_BUFFER, *_UNIFORM_BUFFER, *_STORAGE_BUFFER])
- Favor root constants over root descriptors, and favor root descriptors over descriptor tables when working with constants.
- Make use of root/push constants to enable fast access to constant buffer data (they are pre-loaded into registers).
- Root/push constants are great to use on frequently changing constant buffer data.
- Use root/push constants for cases where the constants are changing at a high frequency.
- If certain Root Signature slots are less frequently used (not referenced by a PSO), put those at the end of the root signature to reduce GRF usage
- Be sure to use hints that allow the driver to perform constant-based optimizations, such as D3D12_DESCRIPTOR_RANGE_FLAG_DATA_STATIC.
- For placed resources, initialize with a clear, copy, or discard before rendering to the resource. This helps enable proper compression by putting the placed resource into a valid state.
- When creating resource heaps, resources that need to be accessed by the GPU should be placed in heaps that are declared as resident in GPU memory, preferably exclusively. This has a significant impact on discrete GPU performance.
- Use queries to identify scenarios when GPU local memory gets oversubscribed and adjust resource location to accommodate this.
Render Targets and Textures
General Guidance
The following application guidelines ensure the efficient use of bandwidth with render targets:
- Use as few render targets as necessary and combine render targets when possible, to make better use of lower-level caches.
- Avoid defining unnecessary channels or higher precision data formats when not needed to conserve memory bandwidth and optimize cache fetches.
- Create multiple resources from the same memory object.
- When possible, create resources in the state that they will first be used. For example, starting in COMMON state then transitioning to DEPTH_WRITE will cause a Hi-Z resolve. Starting in DEPTH_WRITE this example is optimal.
- Vulkan specific for optimal device access:
- Always use VK_IMAGE_LAYOUT_{}_OPTIMAL for GPU access.
- Only use VK_IMAGE_LAYOUT_GENERAL when really needed.
- Only use VK_IMAGE_CREATE_MULTIPLE_FORMAT_BIT when really needed.
UAVs and SSBOs
When dealing with resources that have both read- and write-access in a shader, such as UAVs and shader storage buffer objects (SSBOs), consider the following:
- These resource types may cause inefficient partial writes over the Xe-LP 64-byte cache lines. Avoid these partial writes to get maximum bandwidth through the cache hierarchy. This can be done by ensuring that a single thread executing a given shader on a 4x2 group of pixels writes a contiguous 64 bytes on its own for output.
- Access to read-only data is much more efficient than read/write data. Use these kinds of resources with caution, or when there are no better options.
- Do not set a resource to use a UAV bind flag if the resource will never be bound as a UAV. This programming behavior may disable resource compression.
Anti-Aliasing
To get the best performance when performing multisample anti-aliasing, the following are recommended:
- Minimize the use of stencil or blend when MSAA is enabled.
- Avoid querying resource information from within a loop or branch where the result is immediately consumed or duplicated across loop iterations.
- Minimize per-sample operations. When shading per sample, maximize the number of cases where any kill pixel operation is used to get the best surface compression.
We do recommend using optimized post-processing anti-aliasing such as Temporal Anti-Aliasing and/or Conservative Morphological Anti-Aliasing 2.0.
Resource Barriers
Each resource barrier generally results in a cache flush or GPU stall operation, affecting performance. Given that, the following guidelines are recommended:
- Batch pipeline barriers and use render passes to help properly batch barriers and allow the driver to defer and hoist barriers to render pass edges.
- Avoid command buffers that include only barriers. If needed, put these barriers at the end of the command queue.
- Use implicit render pass barriers when possible.
- Limit the number of resource transitions by batching them and avoid interleaving with dispatches/render passes.
- Generally, avoid barriers outside of render target changes and avoid states like D3D12_RESOURCE_STATE_COMMON unless necessary for presenting, context sharing, or CPU access.
- When possible, supply resources for barriers; they allow more optimal GPU cache flushing, especially for aliasing buffers.
- When possible, employ split barriers to allow for maximum predication of synchronizing events.
- When transitioning resource states, do not over-set them when not in use; it can lead to excessive cache flushes.
Command Submissions
When working with command queues and buffers, the following are recommended:
- Batch command list submission at ExecuteCommandLists in DirectX 12 when possible, but not to the point where the GPU is starved. This ensures efficient use of the CPU and GPU.
- When filling command buffers or command queues, use multiple CPU cores when possible. This reduces single core CPU bottlenecking of your application. Using Intel® Threading Building Blocks (Intel® TBB) can help.
- Use reusable command buffers with caution.
- DirectX 12 specific:
- Avoid the overuse of bundles as they may incur additional CPU and GPU overhead.
- Vulkan specific:
- Use primary command buffers where possible as these provide better performance due to internal batch buffer usage.
- For primary command buffers, use USAGE_ONE_TIME_SUBMIT_BIT.
- For primary command buffers, avoid USAGE_SIMULTANEOUS_USE_BIT.
- Minimize the use of secondary command buffers as they are less efficient than primary command buffers and not as efficient with depth clears.
Optimizing Clear, Copy, and Update Operations
For the best performance on clear, copy, and update operations, follow these guidelines:
- Use the API provided functions for clear, copy, and update operations, and refrain from implementing your own versions. Drivers have been optimized and tuned to ensure that these operations work with the best possible performance.
- Enable hardware “fast clear” values as defined per API:
- In DirectX 12, clear values are defined at resource creation as an argument with ID3D12Device::CreateCommittedResource.
- For Vulkan, use VK_ATTACHMENT_LOAD_OP_CLEAR and avoid using vkCmdClearColorImage.
- Ensure horizontal alignment = 128b and vertical alignment = 64b.
- Copy depth and stencil surfaces only as needed instead of copying both unconditionally; they are stored separately on Xe-LP.
- Batch blit and copy operations.
Geometry Transformation
Ensure that vertex and geometry shader functions operate optimally by following these guidelines:
- Vertex fetch throughput is eight attributes per clock (and max two vertices per clock). Ensure all bound attributes are used. When a draw is bottlenecked on geometry work, reduce the number of attributes per vertex to improve performance.
- Implement a level of detail system that allows flexibility in model accuracy by adjusting the number of vertices per model per level of detail.
- Analyze primitive to pixels covered ratios. When this ratio is high, the extra vertex shader threads add very little value to the final render target. Keep this ratio below 1:4.
- Implement efficient CPU occlusion culling to avoid submitting hidden geometry. This approach can save both CPU (draw submission), and GPU (render) time—we suggest using our highly optimized Masked Software Occlusion Culling. It can eventually be used in combination to finer grain GPU culling.
- Define input geometries as a structure of arrays for vertex buffers. Try to group position information vertex data in its own input slot to assist the tile binning engine for tile-based rendering.
- The Xe-LP vertex cache does not cache instanced attributes. For instanced calls, consider loading attributes explicitly in your vertex shader.
- For full-screen post-processing passes, use a single triangle that covers entire screen space instead of two triangles to form a quad. The shared triangle edge in the two tri-case results in sub-optimal utilization of compute resources.
- Optimize transformation shaders (that is, vertex to geometry shader) to output only attributes that will be used by later stages in the pipeline. For example, avoid defining unnecessary outputs from a vertex shader that will not be consumed by a pixel shader. This enables better use of bandwidth and space with the L3 cache.
- Metal 2 Specific—Tessellation factors are calculated in the compute engine, then returned to the 3D engine to get rendered. Calculate tessellation factors back-to-back for multiple draws to reduce the amount of context switching between 3D and compute workloads.
Tile-Based Rendering
To ensure the most efficient use of Xe-LP tile-based hardware, follow these guidelines for bandwidth limited passes:
- Only use trilist or tristrip topologies.
- For DirectX 12, use ID3D12GraphicsCommandList4::EndRenderPass with D3D12_RENDER_PASS_ENDING_ACCESS_TYPE_DISCARD.
- For Vulkan, use VkRenderPass/VkSubpass with VK_ATTACHMENT_STORE_OP_DONT_CARE.
- Avoid tessellation, geometry, and compute shaders. Passes with tessellation and geometry shaders will not benefit from hardware improvements.
- Avoid intra-render pass read after write hazards.
- Separate the attributes required to compute position into separate vertex buffers.
Shader Optimizations
General Shader Guidance
When writing shaders, look for these opportunities to optimize:
- Xe-LP supports double-rate FP16 math. Use lower precision when possible. Also, note that Xe-LP removed FP64 support to improve power and performance. Make sure that you query hardware support for double-rate, and ensure proper fallback.
- Structure the shader to avoid unnecessary dependencies, especially high latency operations such as sampling or memory fetches.
- Avoid shader control flow based on results from sampling operations.
- Aim for uniform execution of shaders by avoiding flow control based on non-uniform variables.
- Implement early returns in shaders where the output of an algorithm can be predetermined or computed at a lower cost of the full algorithm.
- Use shader semantics to flatten, branch, loop, and unroll wisely. It is often better to explicitly specify the desired unrolling behavior, rather than let the shader compiler make those decisions.
- Branching is preferable if there are enough instruction cycles saved that outweigh the cost of branching.
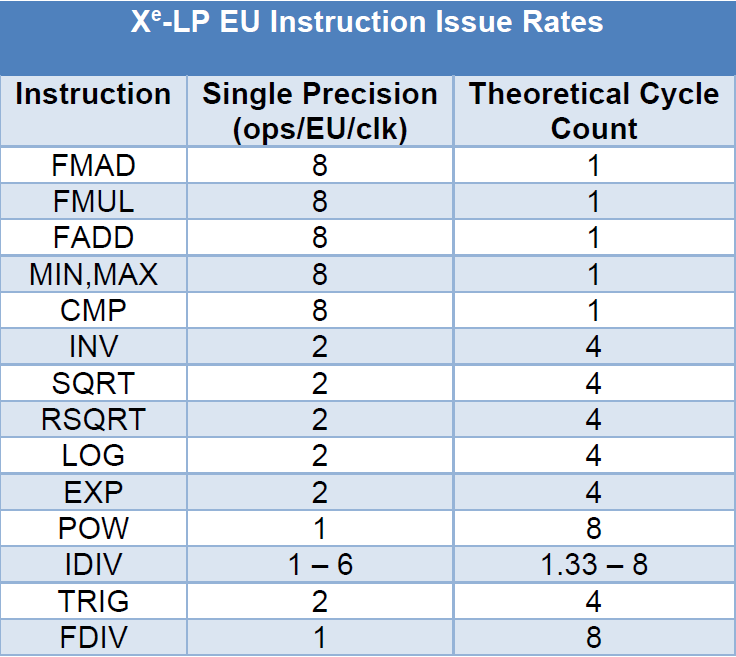
- Extended math and sampling operations have a higher weight, and may be worth branching (see table below for issue rate).
- Small branches of code may perform better when flattened.
- Unroll conservatively. In most cases, unrolling short loops helps performance; however, unrolling loops does increase the shader instruction count. Unrolling long loops with high iteration counts can impact shader residency in instruction caches, and therefore negatively impact performance.
- Avoid extra sampler operations when it is possible that the sampler operation will later be multiplied by zero. For example, when interpolating between two samples, if there is a high probability of the interpolation being zero or one, a branch can be added to speed up the common case and only perform the load only when needed.
- Avoid querying resource information at runtime. For example, High-Level Shading Language (HLSL) GetDimensions call to make decisions on control flow, or unnecessarily incorporating resource information into algorithms.
- When passing attributes to the pixel shader, mark attributes that do not change per vertex within a primitive as constant.
- For shaders where depth test is disabled, use discard (or other kill operations) where output will not contribute to the final color in the render target. Blending can be skipped where the output of the algorithm has an alpha channel value of zero, or when adding inputs into shaders that are zeros that negate output.
Texture Sampling
To get the best performance out of textures and texture operations, consider the following items:
- When sampling from a render target, avoid sampling across mip levels of the surface with instructions such as sample_l/sample_b.
- Use API defined and architecture supported compression formats (that is, BC1-BC7) on larger textures to improve memory bandwidth utilization, and improve memory locality, when performing sampling operations.
- Avoid dependent texture samples between sample instructions. For example, avoid making the UV coordinates of the next sample operation dependent upon the results of the previous sample operation. In this instance, the shader compiler may not be able to optimize or reorder the instructions, and it may result in a sampler bottleneck.
- Avoid redundant and duplicate sampler states within shader code, and use static/immutable samplers, if possible.
- Define appropriate resource types for sampling operation and filtering mode. Do not use volumetric surface as a 2D array.
- When fetching from an array surface, ensure that the index is uniform across all single instruction, multiple data (SIMD) lanes.
- Avoid defining constant data in textures that could be procedurally computed in the shader, such as gradients.
- Avoid anisotropic filtering on sRGB textures.
- Sample_d provides gradient per pixels and throughput drops to one-fourth. Prefer sample_l unless anisotropic filtering is required.
- When using VRS, anisotropic filtering may not be needed, as pixels in that draw will be coarser. Non-anisotropic filtering improves sampler throughput.
Constants
When defining shader constants, the following guidelines can help to achieve better performance:
- Structure constant buffers to improve cache locality so that memory accesses all occur on the same cache line to improve memory performance.
- Favor constant access that uses direct access since the offset is known at compile time, rather than indirect access, in which the offset must be computed at runtime. This benefits high latency operations like flow control and sampling.
- Group the more frequently used constants for better cache utilization and move them to the beginning of the buffer.
- Organize constants by frequency of update, and only upload when the values change.
- When loading data from buffers or structured buffers, organize the data access in a way that all or the majority of the cache line is used. For example, if a structured buffer has ten attributes, and only one of those attributes is used for reading and/or writing, it would be better to split that one attribute into its own structured buffer.
- Consider using ByteAddressBuffers when performing consecutive data loads instead of loading data from a Typed Buffer. Those can be optimized by our shader compiler.
- On DX11, developers will see the best performance in shaders that avoid sparsely referencing the constant data in constant buffers. Best performance will also be achieved if only up to two constant buffers are referenced in non-compute shaders.
Temporary Register Variable Usage
Each thread on an execution unit has its own set of registers to store values. Registers can help reduce memory penalties. However, if there are more temporary variables than registers, some of those variables will have to be stored in memory, where reading and writing have a latency cost. Avoiding this spillover can help to improve performance.
On Xe-LP, reducing register pressure not only increases SIMD width, but also betters code scheduling.
When writing shaders, the following help reduce spillover and improve performance:
- Try to optimize the number of temporaries to 16, or fewer, per shader. This limits the number of register transfers to and from main memory, which has higher latency costs. Check the instruction set assembly code output, and look for spill count. Spills are a good opportunity for optimization as they reduce the number of operations that depend on high latency memory operations. This can be done in Intel GPA by selecting a shader and choosing to look at the machine code generated by the compiler.
- If possible, move the declaration and assignment of a variable closer to where it will be referenced.
- Weigh the options between full and partial precision on variables, as this can store more values in the same space. Use caution when mixing partial precision with full precision in the same instruction—it may cause redundant type conversions.
- Move redundant code that is common between branches out of the branch. This can reduce redundant variable duplication.
- Avoid non-uniform access to constant buffer/buffer data. Non-uniform access requires more temporary registers to store data per SIMD lane.
- Avoid control flow decision based on constant buffer data, as this forces the compiler to generate sub-optimal machine code. Instead, use specialization constants, or generate multiple specialized shader permutations.
Compute Shader Considerations
When developing compute shaders, the following guidelines can help to achieve optimal performance when selecting thread group sizes:
- Pick thread-group sizes and dimensions that fit the nature of your workload’s memory access patterns. For instance, if your application accesses memory in a linear fashion, specify a linear dimension thread group size—such as 64 x 1 x 1.
- For two-dimensional thread groups, smaller thread-group sizes typically lead to better performance, and achieve better execution unit thread occupancy.
- Generally, a thread-group size of 8 x 8 performs well on Xe-LP. In some cases, this may not be optimal due to memory access patterns and/or cache locality. In this case, dimensions of 16x16 or higher should be experimented with, based on their performance in testing.
- Thread-group size higher or equal to 256 threads can cause thread occupancy issues.
- Avoid using Atomics on UAVs when possible. However, Atomics on SLM variables do not show any performance issues.
When developing compute shaders that use SLM, consider the following:
- Minimize the number of reads and writes. For instance, an array of float4 data should be loaded and stored in one bank of float4 types, rather than four banks of float arrays.
- Try to keep variables in registers rather than shared local memory to save on memory access penalties.
- Load and store data so that data elements consecutively accessed are located back-to-back. This allows read and write access to be coalesced, and bandwidth to be used efficiently.
- Use HLSL interlocked functions to perform min, max, or, and other reductions, instead of moving data to and from SLM to perform the same operation with a user-defined operation. The compiler can map HLSL functions to a hardware-implemented version.
- Avoid using more than 73-Byte of SLM per lane, as this will reduce the SIMD width. Examples:
- For 8x8 thread group use less than 4,672-Byte
- For 16x16 thread group use less than 18,688-Byte
Wave Intrinsics
Xe-LP supports the use of wave intrinsics for both 3D and compute workloads. These can be used to write more efficient register-based reductions, and to reduce reliance on global or local memory for communication across lanes. Threads within the thread group can share information without the use of barriers, and other cross lane operations for threads are enabled in the same wave. While working with wave intrinsics on Gen11, consider the following:
- Do not write shaders that assume a specific machine width. Wave width can vary across shaders from SIMD8, SIMD16, and SIMD32, and is chosen by heuristics in the shader compiler. Because of this, use instructions such as WaveGetLaneCount() in algorithms that depend on wave size.
- Wave operations can be used to reduce memory bandwidth by enabling access to data already stored in registers by other threads, instead of storing and re-loading results from memory. It is a great fit for optimizing operations such as texture mipmap generation.
Frame Presentation
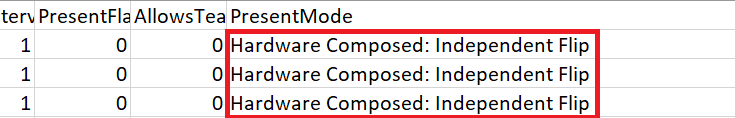
For the best performance and compatibility across different Windows versions, it is recommended to use full-screen presentation modes if possible. Other modes require an extra context switch and full screen copy. On Windows 10, it is possible to use full-screen borderless windowed modes with no penalty and no performance loss to the Desktop Window Manager. In doubt, use tools such as PresentMon to know which presentation mode is active, and GPUView (part of the Windows® 10 SDK) for possible intervention by the Desktop Window Manager.
Ensure that PresentMon reports “Hardware Composed: Independent Flip” and that no activity is reported by DWM.exe in your ETW trace.
Dual Queue Support
Xe-LP supports the use of dual queues, which can concurrently have 3D and compute workloads resident in the threads of each sub-slice. When sharing resources across queues, use COMMON state transitions when possible.
CPU performance considerations
- The DX11 driver utilizes threading to perform work parallelization. Fully subscribing all available CPU hardware threads with application work can result in starvation of these helper threads, and significantly reduce performance. Query the available hardware threads on the system your application is running on, and leave the better portion of one hardware thread free for the driver to parallelize work.
- The DX12 driver relies heavily on background shader optimizations. Do NOT disable this thread. If you do, it will significantly increase loading times—and can also reduce GPU performance as these optimizations can no longer be performed. Also, ensure you leave at least one CPU hardware thread available to perform this work—do not fully subscribe every available hardware thread on the CPU with application work.
Design for Low Power
Mobile and ultra-mobile computing are ubiquitous. On these platforms, power is shared between CPU and GPU, so optimizing for CPU can frequently result in GPU performance gains. As a result, battery life, device temperature, and power-limited performance have become significant issues. As manufacturing processes continue to shrink and improve, we see improved performance per-watt characteristics of CPUs and processor graphics. However, there are many ways that software can reduce power use on mobile devices, as well as improve power efficiency. In the following sections, you will find insights and recommendations illustrating how to best recognize these performance gains.
Idle and Active Power
Processors execute in different power states, known as P-states and C-states. C-states are essentially idle states that minimize power draw by progressively shutting down more and more of the processor. P-states are performance states where the processor consumes progressively more power and runs faster at a higher frequency.
These power states define how much time the processor is sleeping and how it distributes available power when active. Power states can change very quickly, so sleep states are relevant to most applications that do not consume all the power available, including real-time applications.
When you optimize applications, try to save power in two different ways:
- Increase the amount of idle time your application uses where it makes sense.
- Improve overall power usage and balance under active use.
You can determine the power state behavior of your application by measuring how much time it spends in each state. Since each state consumes a different amount of power, you will get a picture over time of your app’s overall power use.
Analysis Tips
To start, begin by measuring your app’s baseline power usage in multiple cases and at different loads:
- At near idle, as in the user interface (UI) during videos
- Under an average load during a typical scene with average effects
The worst-case load may not occur where you expect it to. We have seen very high frame rates [1,000 frames per second (fps)] during cut-scene video playback in certain apps, a situation that can cause the GPU and CPU to use unnecessary power. As you study your application, try a few of these tips:
- Measure how long (on average) your application can run on battery power, and compare its performance with other, similar apps. Measuring power consumption regularly informs you if any recent changes caused your app to use more power.
- The Battery Life Analyzer (BLA) is a good (Windows-only) tool for this work, as it can collect high-level data and analyze an app's power use. If the data that BLA provides shows that you have issues residing in the wrong C-states for too long, it is time to look deeper.
- If your app is reported as deficient or there are unexpected wakeups, start optimizing for power. To do so, you will want to look at the Windows Performance Analyzer (WPA) tool, which showcases workflow using WPA for CPU analysis.
- Intel® VTune™ Profiler XE is also useful to get power call stacks, since it can identify the cause of the wakeup.
Use the data gained through these methods to reduce or consolidate wakeups, thus remaining in a lower power state longer.
Investigating Idle Power
As you study power at near idle, watch for very high frame-rates.
If your app has high frame-rates at near idle power (during cut scenes, menus, or other low-GPU intensive parts), remember that these parts of your app will look fine if you lock the present interval to a 60 Hz display refresh rate (or clamp your frame rate lower, to 30 fps).
Watch for these behaviors in menus, loading screens, and other low-GPU intensive parts of games, and scale accordingly to minimize power consumption. This can also improve CPU intensive loading times, by allowing turbo boost to kick in, when necessary.
Active Power and Speed Shift
While in active states, the processor and the operating system jointly decide frequencies for various parts of the system (CPUs, GPU, and memory ring, in particular). The current generation of Intel Core processors add more interaction between the operating system and the processor(s) to respond more efficiently and quickly to changes in power demand—a process referred to as Intel® Speed Shift Technology.
The system balances the frequencies based on activity and increases frequency (and thus consumed power) where it is needed most. As a result, a mostly active workload may have its GPU and CPU balance frequencies based on power consumption.
Reducing the amount of work done on the CPU can free up power for the GPU and vice versa. This can result in better overall performance, even when the other side was the primary performance bottleneck.
Tools such as Intel® Power Gadget can also help you see the frequencies of each clock domain in real time. You can monitor the frequencies of different subsystems on target devices by running this tool.
You can tell that your app’s power distribution is getting balanced when the primary performance bottleneck is not running at full frequency, but power consumption is reaching the maximum limits available.
When and How to Reduce Activity
There are times when the user explicitly requests trading performance for battery life, and there are things you can do to more effectively meet these demands. There are also patterns in application usage that always consume extra power for little return, patterns that you can more effectively address to handle overall power usage. In the next sections you will see some issues to watch for when trying to reduce overall power consumption.
Scale Settings to Match System Power Settings and Power Profile
It was once necessary to poll for power settings and profile (for example, GetSystemPowerStatus()), but since the launch of Windows® Vista, Windows® supports asynchronous power notification APIs.
- Use RegisterPowerSettingNotification() with the appropriate globally unique identifier (GUID) to track changes.
- Scale your app's settings and behavior based on the power profile and whether your device is plugged in to power. Scale the resolution, reduce the max frame rate to a cap, and/or reduce quality settings.
- If you cap the frame rate, you can use V-Sync. You can also manage the frame rate and resolution yourself as well. The dynamic resolution rendering (DRR) sample shows how to adjust frame resolution to maintain a frame rate.
Run as Slow as You Can While Remaining Responsive
If you run as slow as you can (but still remain responsive) then you can save power and extend battery life.
- Detect when you are in a power-managed mode and limit frame rate. This prolongs battery life and allows your system to run cooler. Running at 30 Hz instead of 60 Hz can save significant power.
- Provide a way to disable the frame rate limit, for benchmarking. Warn players that they will use their battery quickly. You should also want to let the player control the frame rate cap.
- Use off-screen buffers and do smart compositing for in-game user interfaces (which are often limited to small panels for displays like health, power-ups, and so on). Since user interfaces usually change much more slowly than in-game scenes, there is no need to change them at the same rate as the game frame. Here again, DRR may be useful in helping you decouple UI rendering from main scene rendering.
Manage Timers and Respect System Idle, Avoid Tight Polling Loops
There are several other related points to watch:
- Reduce your app's reliance on high-resolution periodic timers.
- Avoid Sleep() calls in tight loops. Use Wait*() APIs instead. Sleep() or any other busy-wait API can cause the operating system to keep the machine from being in the Idle state. Intel® Mobile Platform Idle Optimization presentation offers an extensive rundown of which APIs to use and to avoid.
- Avoid tight polling loops. If you have a polling architecture that uses a tight loop, convert it to an event-driven architecture. If you must poll, use the largest polling interval possible.
- Avoid busy-wait calls. This can cause unnecessary power use. There is no way for the operating system, or the power management hardware, to detect that the code does nothing useful.
Multithread Sensibility
Balanced threading offers performance benefits, but you need to consider how it operates alongside the GPU, as imbalanced threading can also result in lower performance and reduced power efficiency. Avoid affinitizing threads so that the operating system can schedule threads directly. If you must, provide hints using SetIdealProcessor().
Using CPU SIMD
Using CPU SIMD instructions, either through the Intel® SPMD Program Compiler (Intel® ISPC) or C++ intrinsics, can provide a significant power and performance boost. These improvements can be even bigger by using the latest instruction set.
However, on processors prior to Intel® 10th generation Core™ (Codename Icelake), using AVX2 and particularly AVX512 SIMD instruction requires a voltage increase in order to power the SIMD architecture block. In order to avoid power increase, Intel Core processors will run at a lower frequency, which can decrease performance for a mostly scalar workload with a few SIMD instructions. For this reason, sporadic AVX512 SIMD usage should be avoided on these older processors.
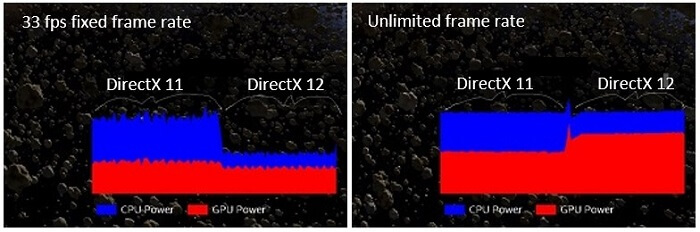
Power Versus Frame Rate
The latest graphics APIs (DirectX 12, Vulkan, and Metal 2) can dramatically reduce CPU overhead, resulting in lower CPU power consumption given a fixed frame rate (33 fps), as shown on the left side in the figure below. When unconstrained by frame rate the total power consumption is unchanged, but there is a significant performance boost due to increased GPU utilization. See the Asteroids* and DirectX* 12 white paper for full details.
Additional Resources on Intel® Developer Zone and Game Dev Websites
Intel® Software Developer Zone and Game Dev Websites
Intel® regularly releases code samples covering a variety of topics to the developer community. For the most up-to-date samples and links, see the following resources:
Intel® Software Developer Zone Code Samples
Following are descriptions and links to samples that may also be of interest to developers targeting current Intel® systems.
Dynamic Resolution Rendering
DRR is an algorithm that aims to increase and smoothen game performance by trying to keep a fixed displayed render target resolution, but dynamically varies the resolution that is driving the engine shading.
One of the primary issues inhibiting adoption of DRR is the modification to post-processing pipelines that it requires. With the introduction of DirectX 12 and placed resources we are introducing an updated algorithm implementation that removes the need for most, if not all, post-processing pipeline modifications at the cost of increasing your memory requirements with an additional dynamic resolution render target buffer.
Checkerboard Rendering
While some graphics optimizations focus on reducing geometric level of detail, checkerboard rendering (CBR) reduces the amount of shading done that is imperceptible. The technique produces full resolution pixels that are compatible with modern post processing techniques and can be implemented for both forward and deferred rendering. More information, implementation details, and sample code can be found in the white paper Checkerboard Rendering for Real-Time Upscaling on Intel Integrated Graphics.
Conservative Morphological Anti-Aliasing 2.0
Conservative Morphological Anti-Aliasing 2.0 (CMAA-2) is an update to the image-based conservative morphological anti-aliasing algorithm. This implementation provides improvements to the anti-aliasing quality and performance of previous implementations. For more information, refer to the Conservative Morphological Anti-Aliasing 2.0 white paper.
Adaptive Screen Space Ambient Occlusion
Screen space ambient occlusion (SSAO) is a popular effect used in real-time rendering to produce small-scale ambient effects and contact shadow effects. It is used by many modern game engines, typically using 5 to 10 percent of the frame GPU time. Although several public implementations already exist, not all are open source or freely available, or provide the level of performance scaling required for both low-power mobile and desktop devices. This is where Adaptive Screen Space Ambient Occlusion (ASSAO) fills needed gaps. ASSAO is specially designed to scale from low-power devices and scenarios up to high-end desktops at high resolutions, all under one implementation with a uniform look, settings, and quality that is equal to the industry standard. For more information, refer to the white paper Adaptive Screen Space Ambient Occlusion.
GPU Detect
The GPU Detect sample demonstrates how to get the vendor and ID from the GPU. For Intel® Processor Graphics, the sample also demonstrates a default graphics quality preset (low, medium, or high), support for DirectX 9 and DirectX 11 extensions, and the recommended method for querying the amount of video memory. If supported by the hardware and driver, it also shows the recommended method for querying the minimum and maximum frequencies.
The sample uses a configuration file that lists many of the Intel® Processor Graphics by vendor ID and device ID, along with a suggested graphics quality level for each device. To maximize performance, you should test some representative devices with your application and decide which quality level is right for each. Be careful with relying only on device ID, as a platform’s performance also depends heavily on the available power, which can be set by the device manufacturer to something lower than the optimal thermal design point.
Fast ISPC Texture Compression
The Fast ISPC Texture Compressor sample performs high-quality BC7, BC6H, ETC1, and ASTC compression on the CPU using the ISPC to exploit SIMD instruction sets.
Additional Resources
Hybrid optimization guidance – Game Dev Guide for 12th Gen Intel® Core™ Processor
Direct3D* Website – DirectX 12 and other DirectX resources
Vulkan* – Khronos site with additional resources
Metal 2 – Apple’s developer site for Metal 2
Revision History
| Original Release | June 2021 |
| Update | March 2023 |
Notices
Intel technologies’ features and benefits depend on system configuration and may require enabled hardware, software or service activation. Performance varies depending on system configuration. Check with your system manufacturer or retailer or learn more at intel.com.
No license (express or implied, by estoppel or otherwise) to any intellectual property rights is granted by this document.
Intel disclaims all express and implied warranties, including without limitation, the implied warranties of merchantability, fitness for a particular purpose, and non-infringement, as well as any warranty arising from course of performance, course of dealing, or usage in trade.
This document contains information on products, services and/or processes in development. All information provided here is subject to change without notice. Contact your Intel representative to obtain the latest forecast, schedule, specifications and roadmaps.
The products and services described may contain defects or errors known as errata which may cause deviations from published specifications. Current characterized errata are available on request.
Copies of documents which have an order number and are referenced in this document may be obtained by calling 1-800-548-4725 or by visiting www.intel.com/design/literature.htm.
Intel, the Intel logo, Intel Core, and VTune are trademarks of Intel Corporation in the U.S. and/or other countries.
Microsoft, Windows, and the Windows logo are trademarks, or registered trademarks of Microsoft Corporation in the United States and/or other countries.
*Other names and brands may be claimed as the property of others.
© 2023 Intel Corporation